Project 05
Python
Public data
TopStateHeatmap
§ 01
In the browser
What it looks like
§ 02
Overview
What it measures
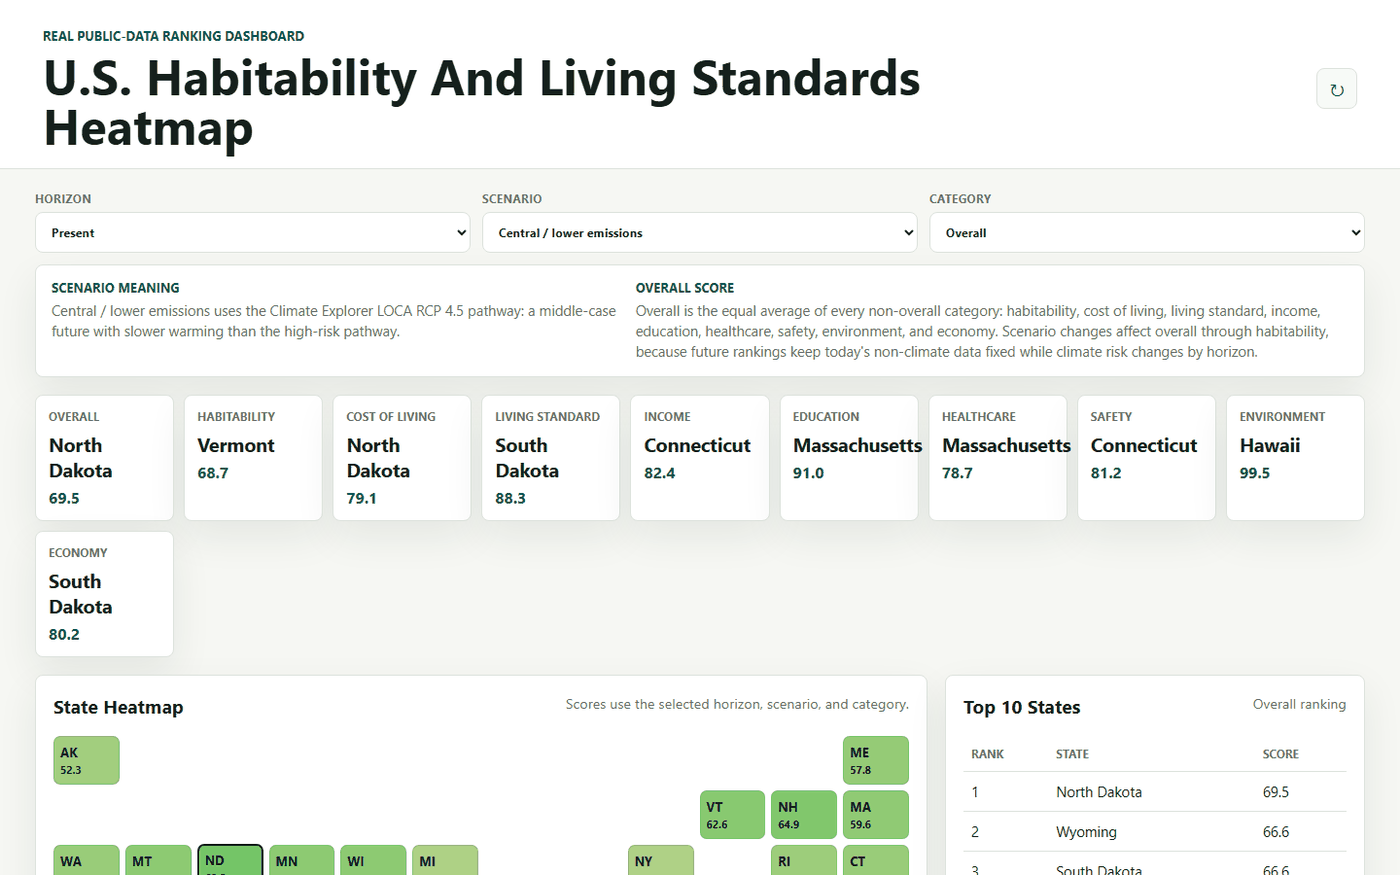
Seven scores per state: habitability, cost of living, living standard, income, education, healthcare, and an equal-weighted overall score that combines them. The weighting is deliberately flat rather than tuned — the interesting part is seeing which states hold up across every dimension rather than winning one.
Everything runs locally. The app caches processed public data in
data/cache/state_scores.json, so a run after the first does not
re-fetch from the source agencies.
§ 03
Sources
Where the numbers come from
-
Census ACS
American Community Survey data for income and demographic measures.
-
BEA regional price parities
Bureau of Economic Analysis cost-of-living adjustment by region.
-
CDC PLACES
Local-level health outcome and prevalence estimates.
-
FEMA National Risk Index
Natural-hazard risk contributing to the habitability score.
-
NOAA / NEMAC Climate Explorer
ACIS LOCA downscaled climate projections for the long-range outlook.
-
NCES NAEP
National Assessment of Educational Progress results for education scoring.
On the 100-year view. It is labeled a 2100 proxy and
uses the 2090–2099 climate projection window — a stand-in for the
century mark, not a point forecast for the year 2100.
§ 04
Run it
Run it locally
git clone https://github.com/eputnam77/TopStateHeatmap.git
cd TopStateHeatmap
python app.py
Then open http://127.0.0.1:4176. To rebuild the cached dataset without
starting the server:
python app.py --refresh-only§ 05
Details
Details
| Repository | github.com/eputnam77/TopStateHeatmap |
|---|---|
| Coverage | 50 U.S. states |
| Scores | Habitability, cost of living, living standard, income, education, healthcare, overall |
| Local port | 127.0.0.1:4176 |
| Data cache | data/cache/state_scores.json |
| Tests | Ruff and pytest; API end-to-end tests use deterministic synthetic data and make no network calls |
| Author | Eric Putnam |